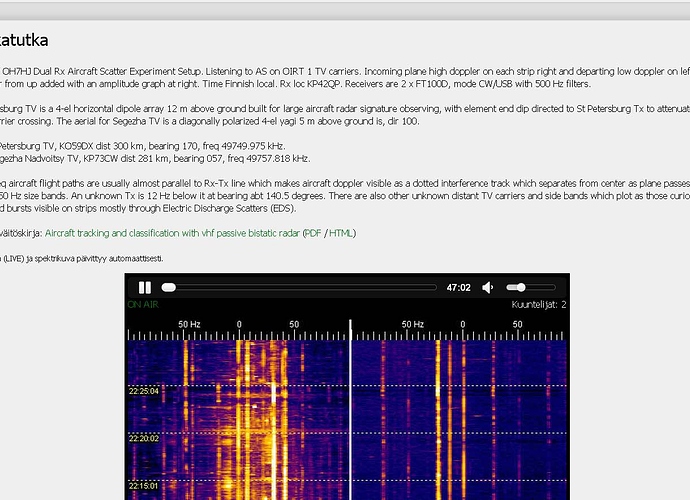
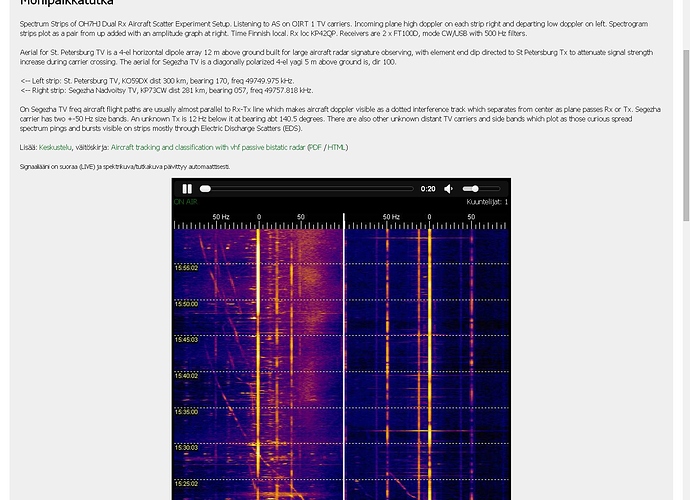
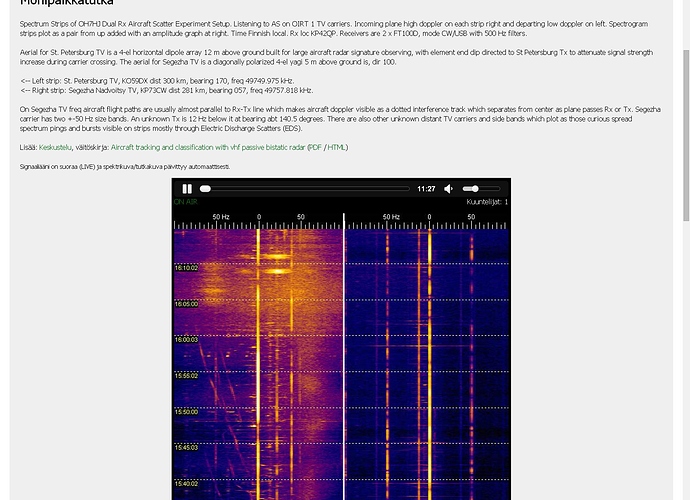
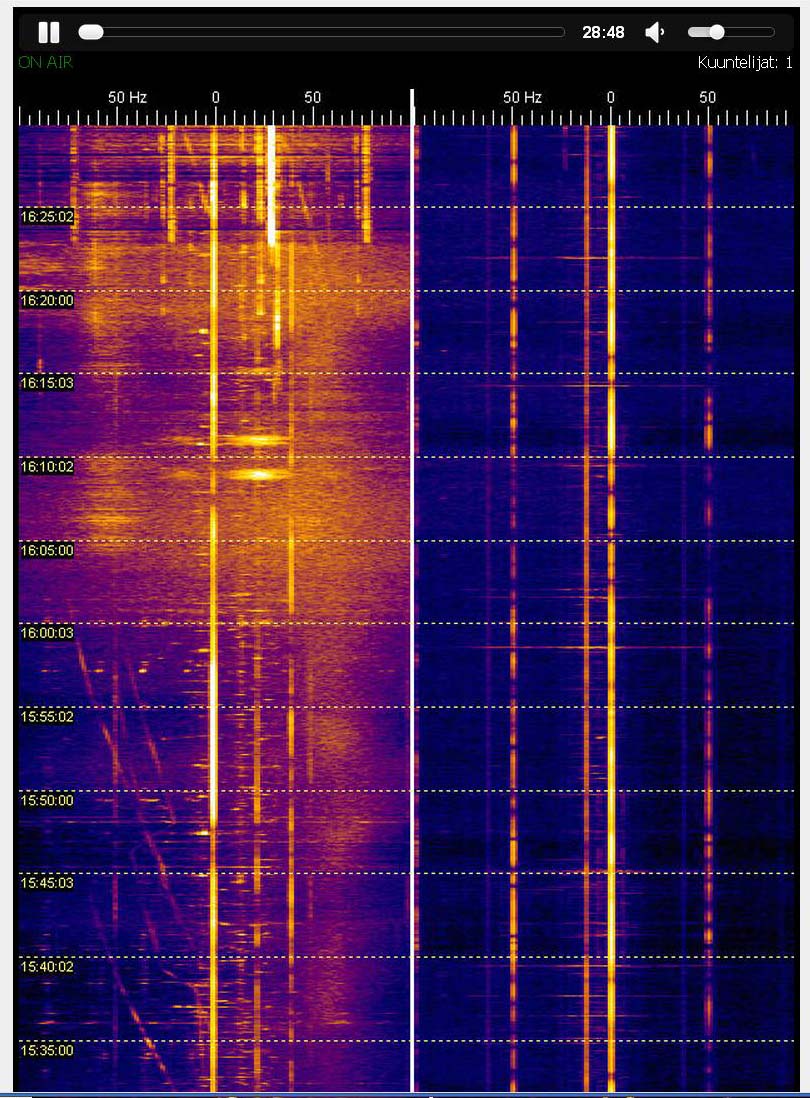
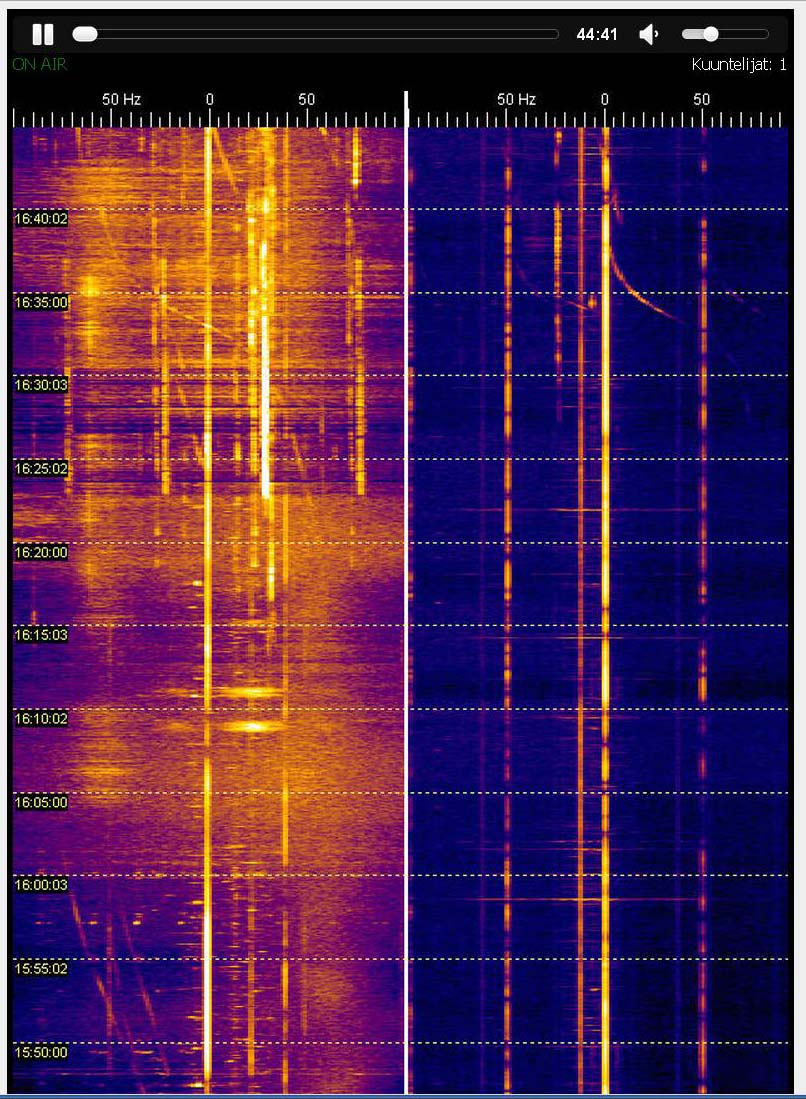
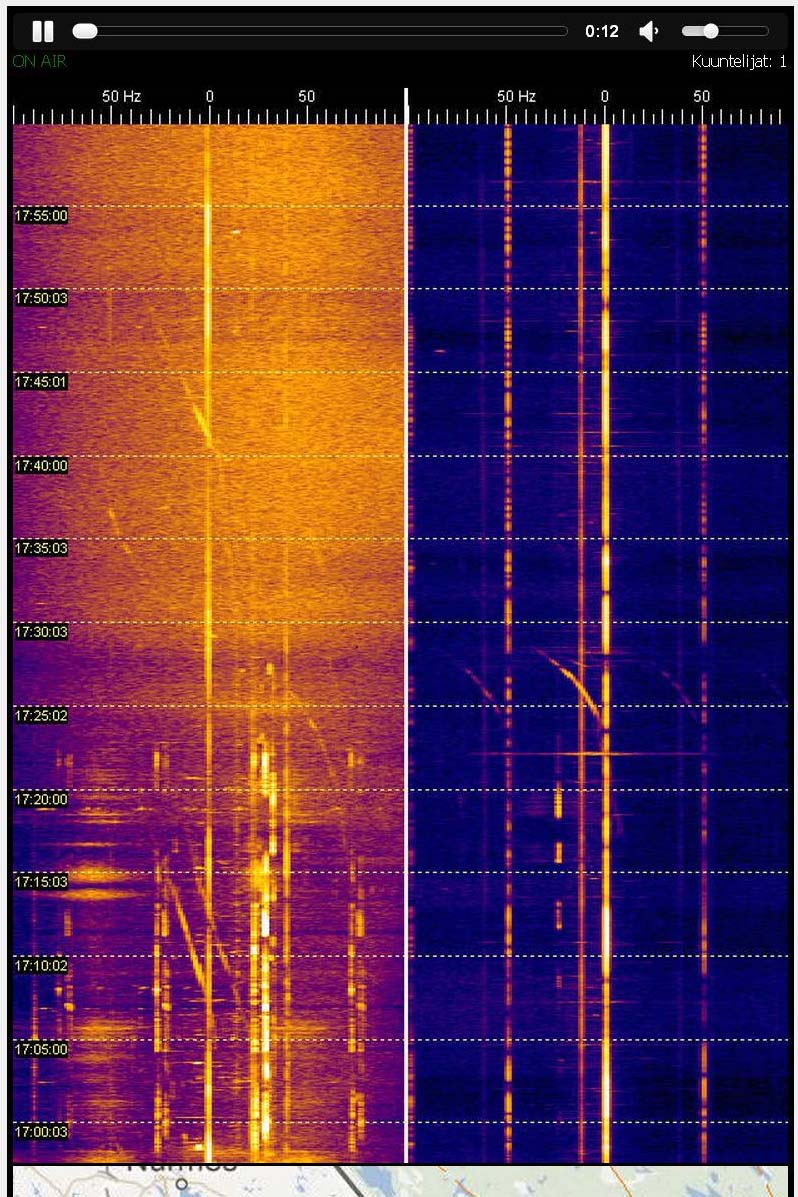
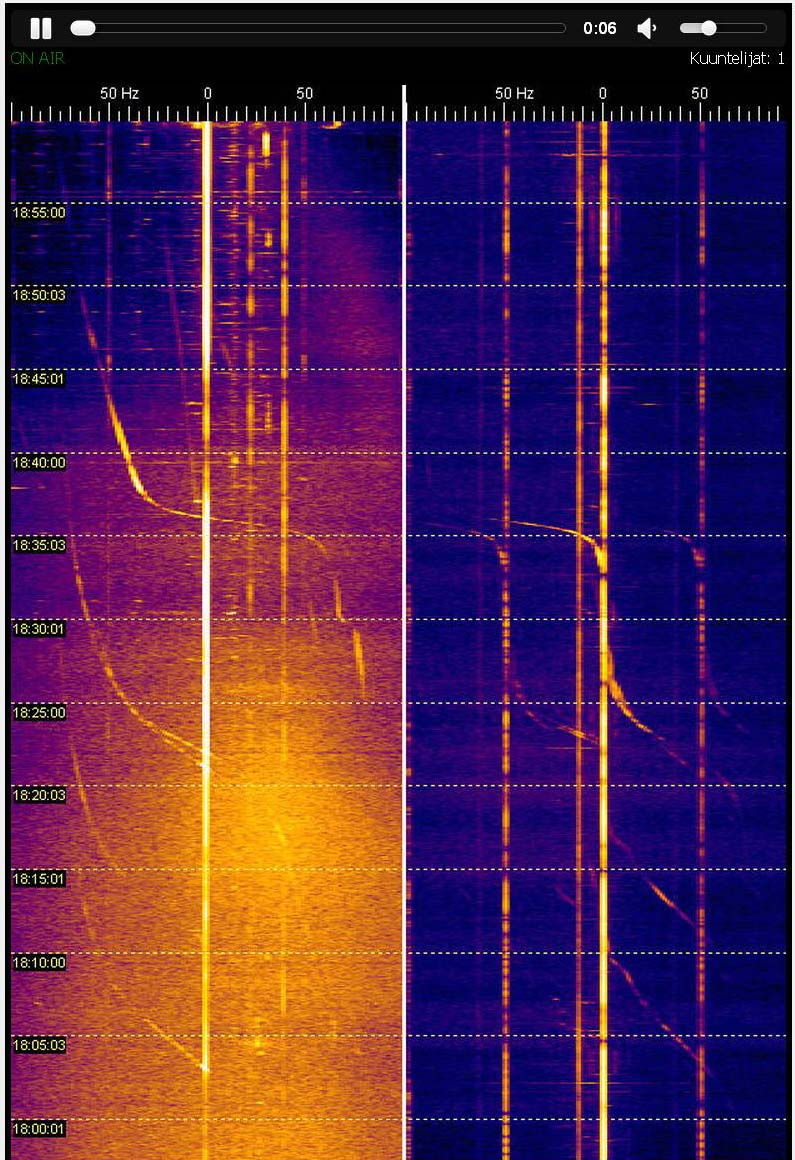
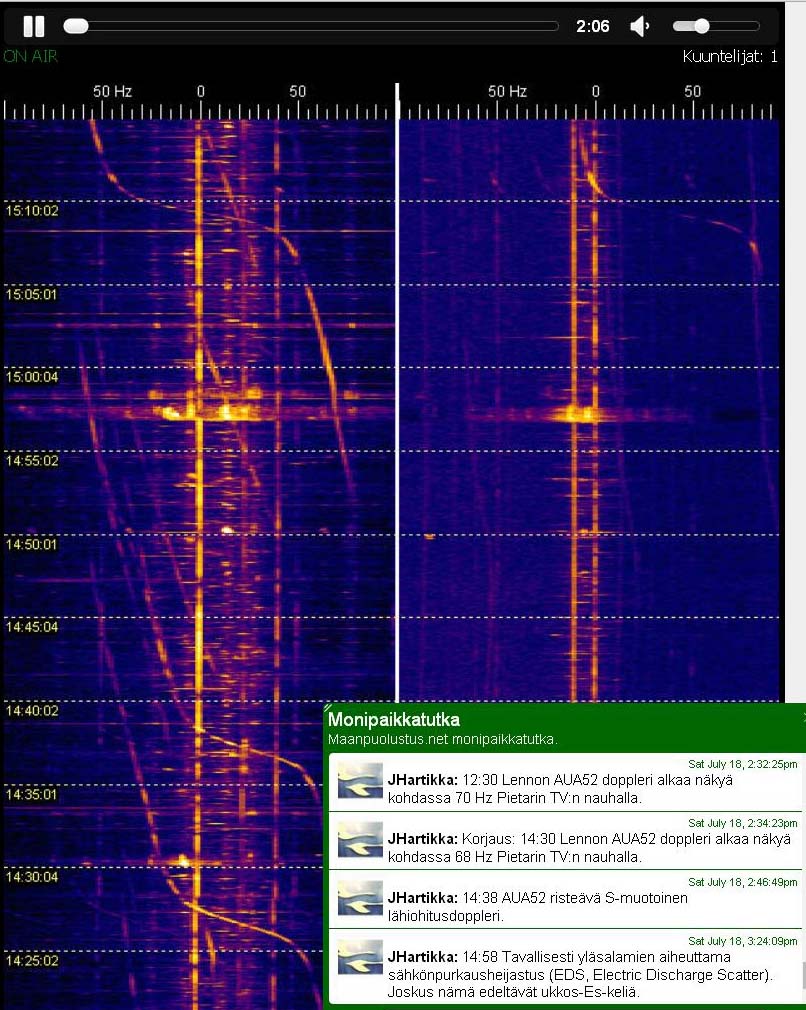
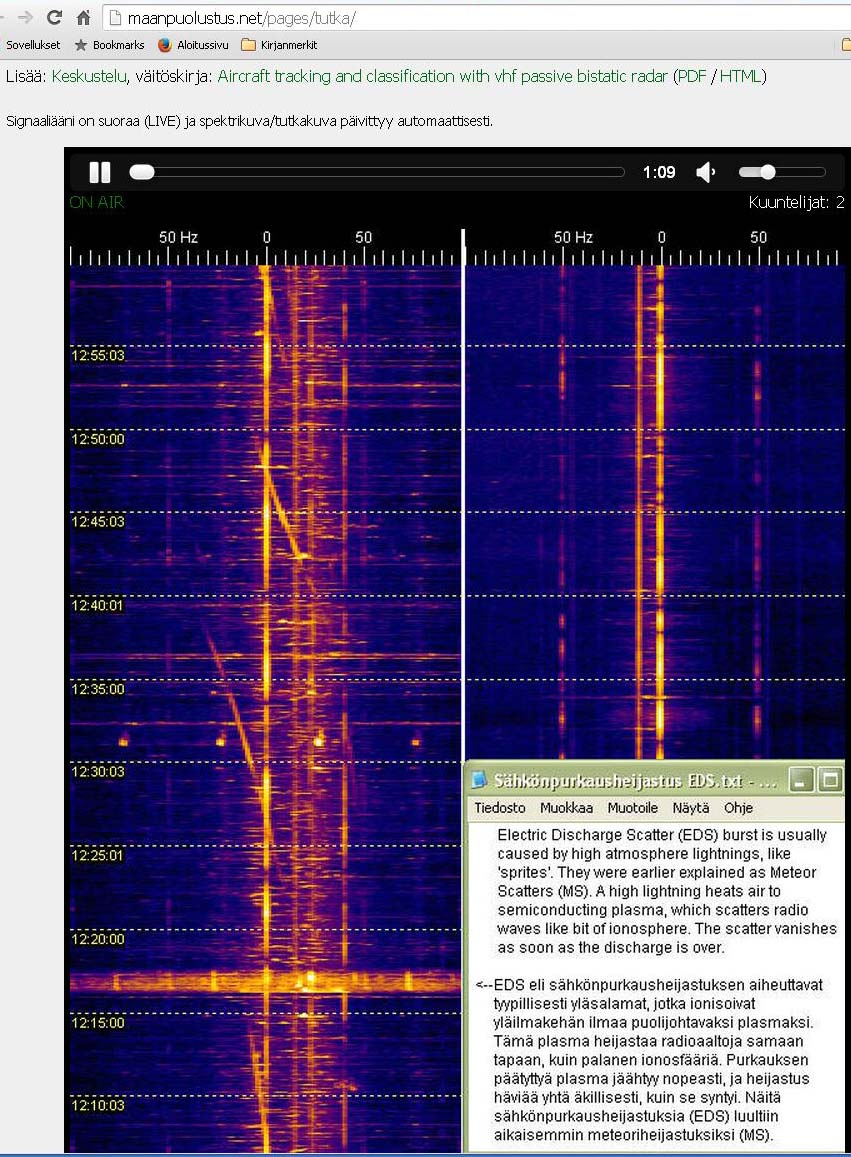
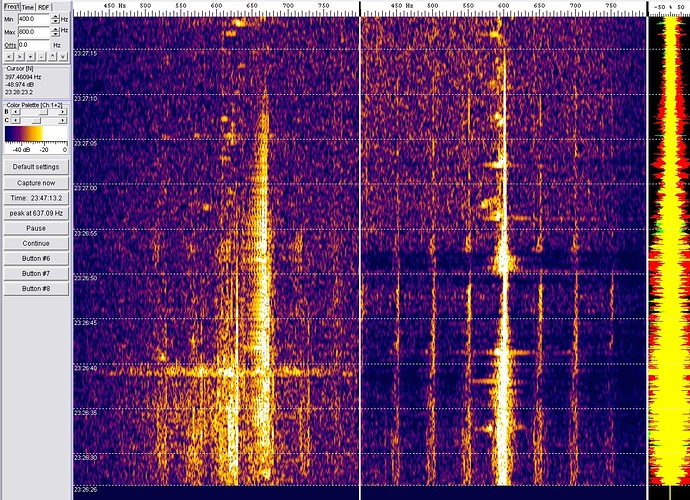
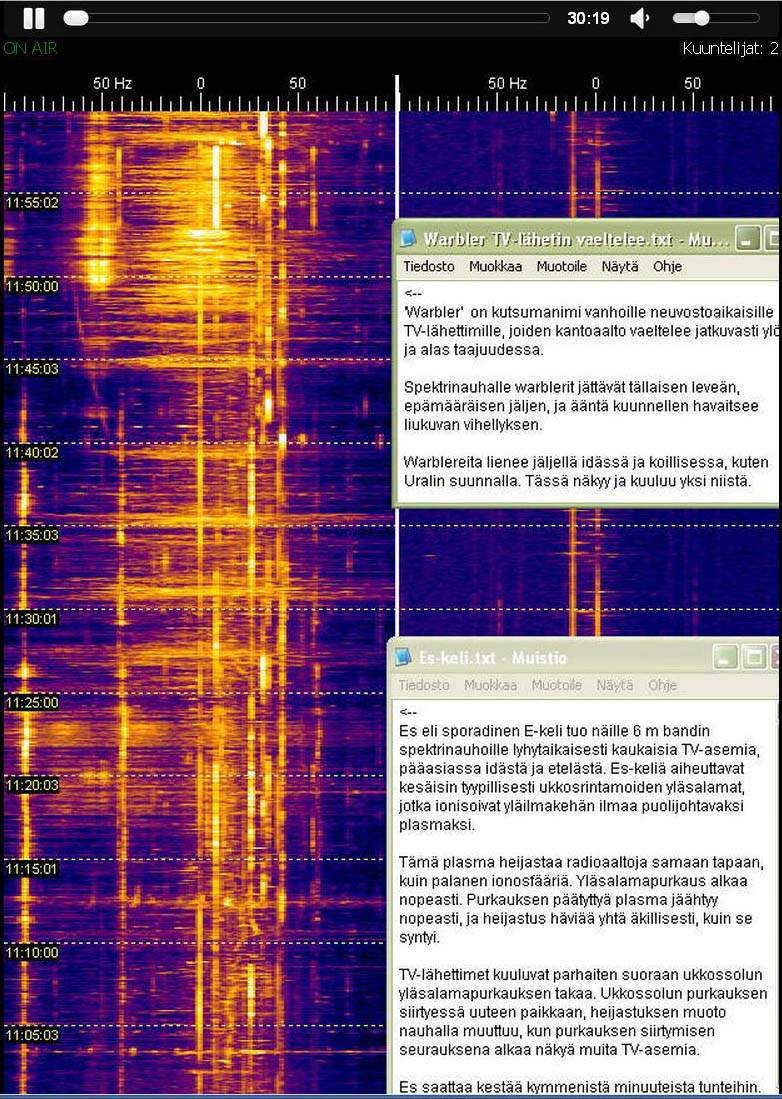
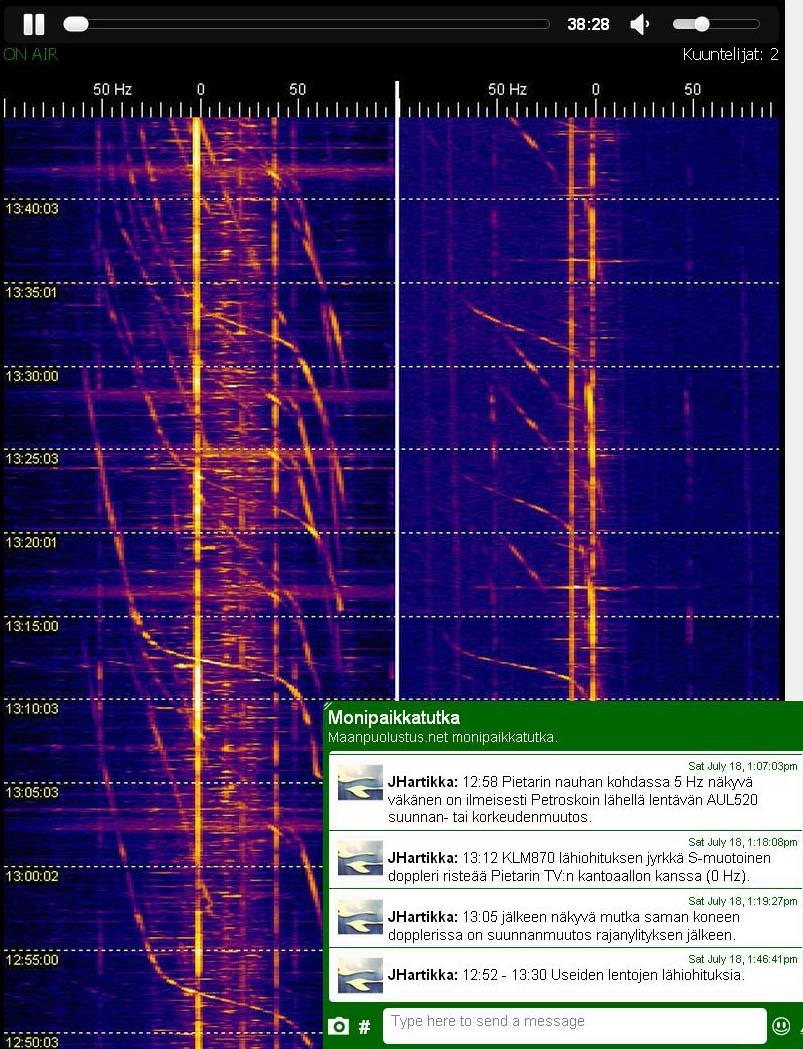
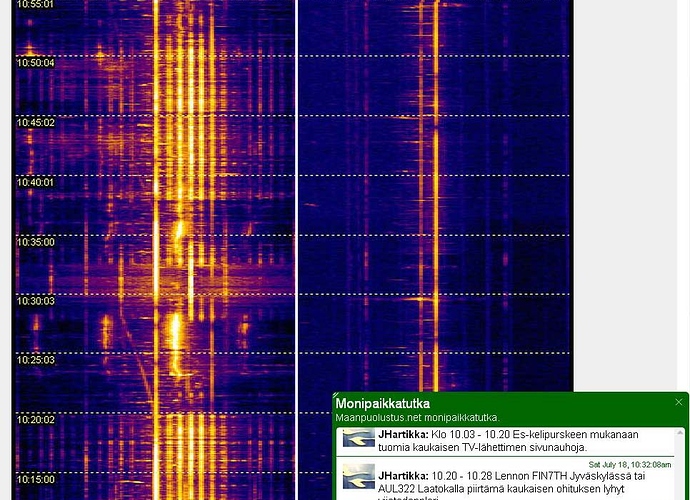
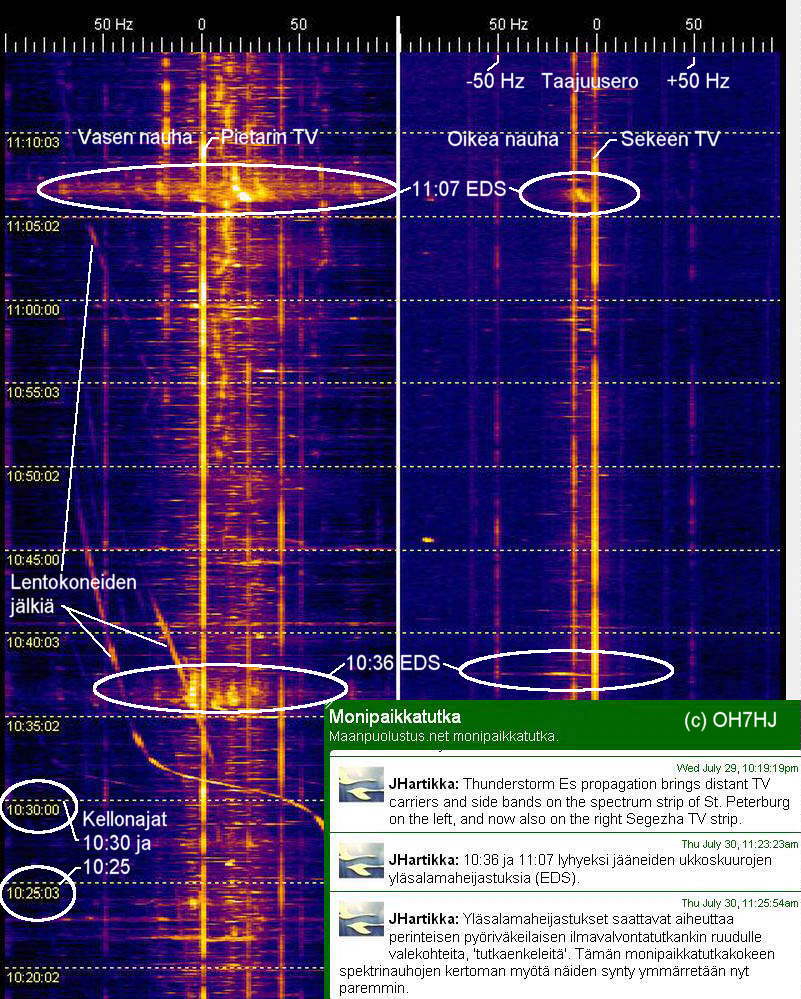
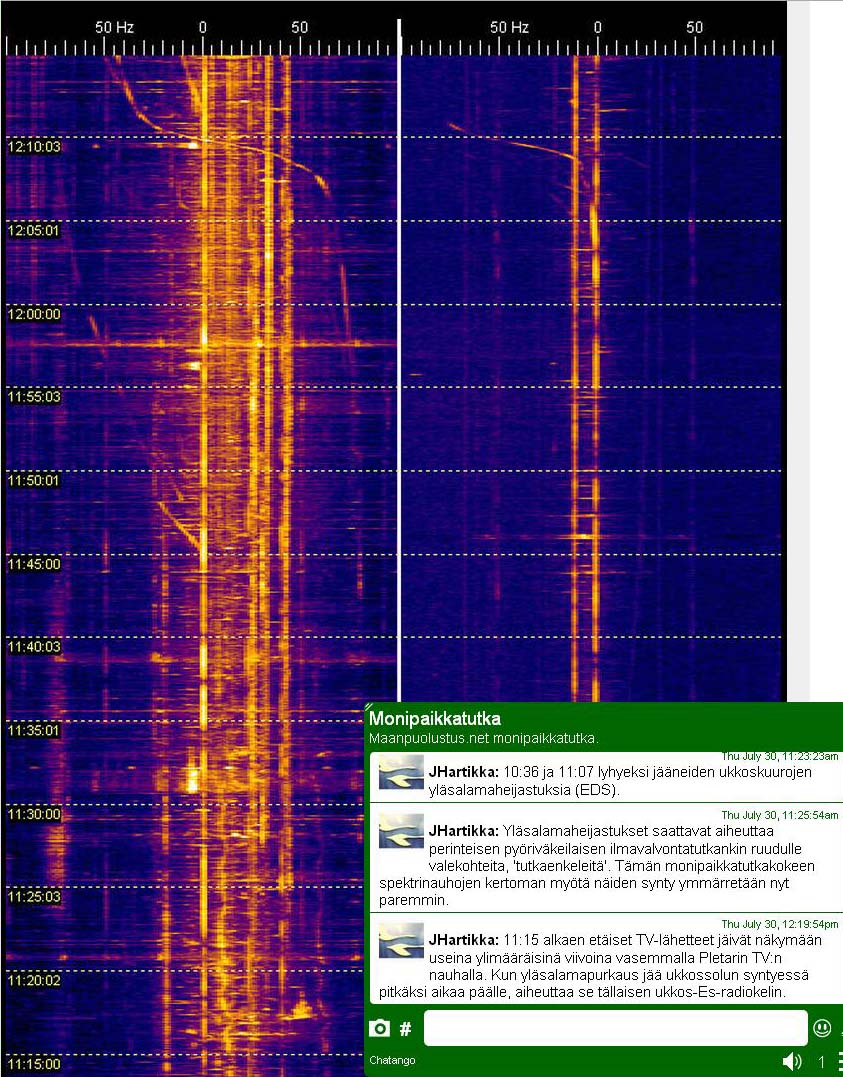
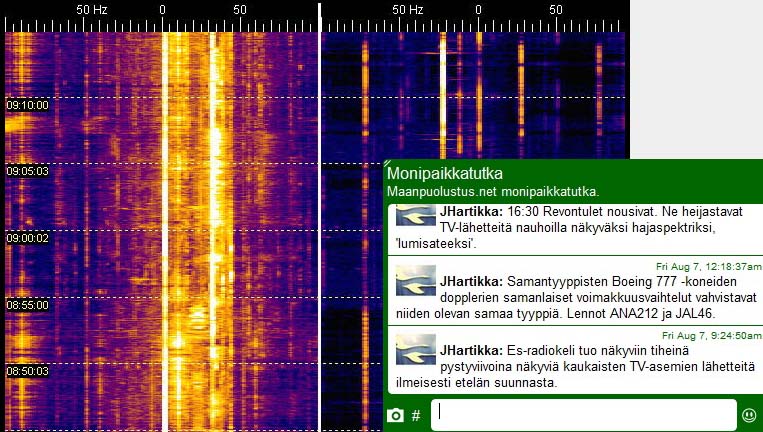
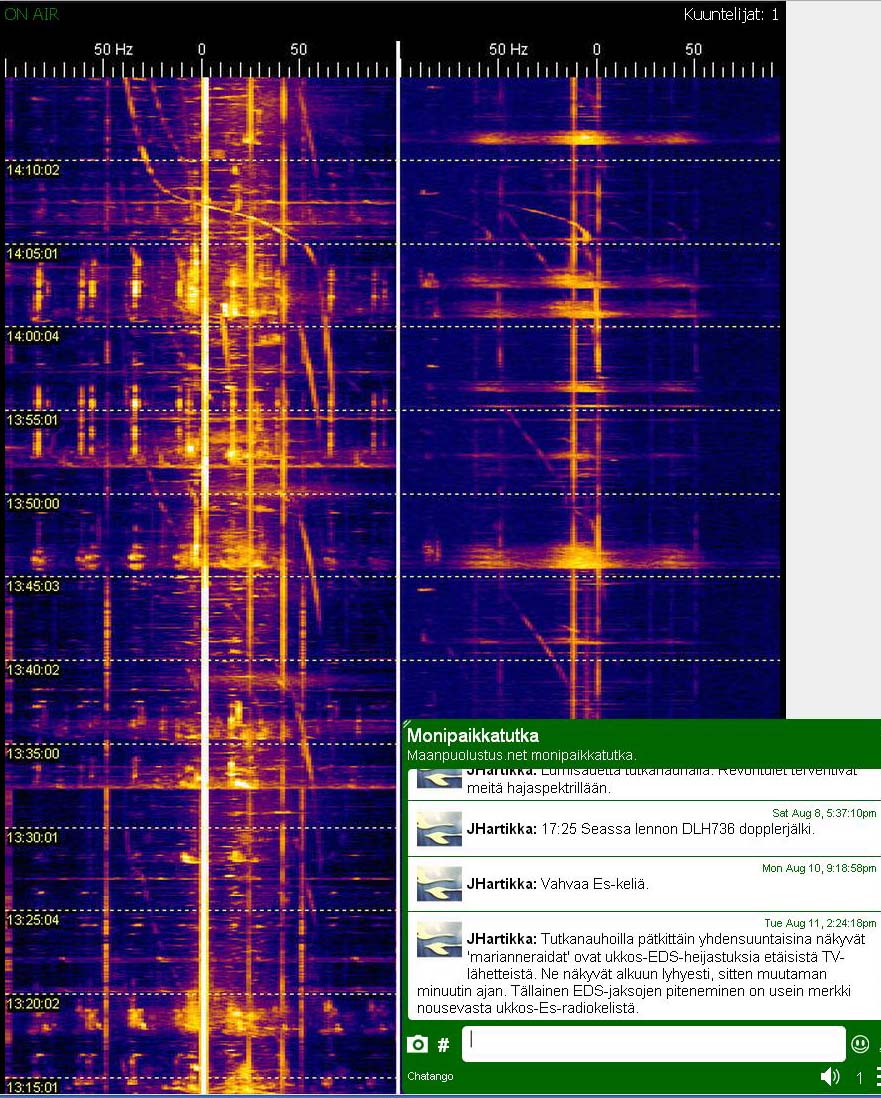
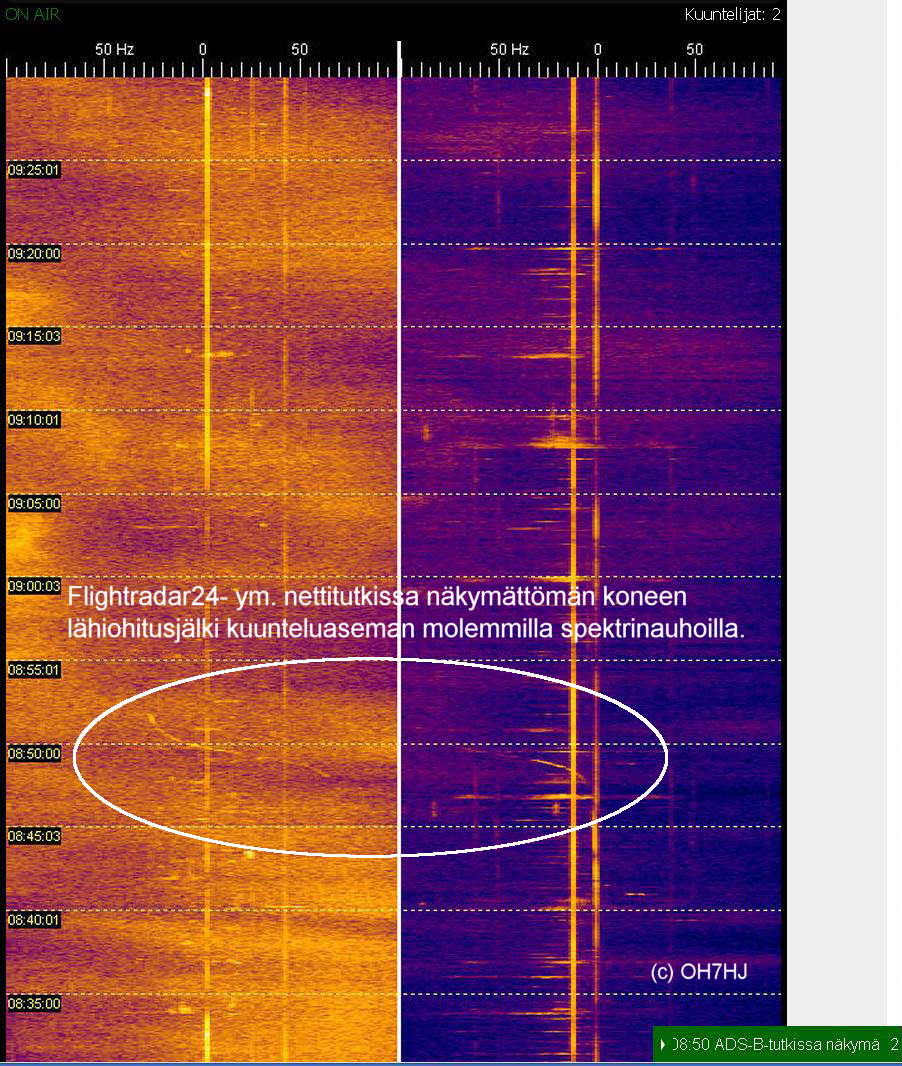
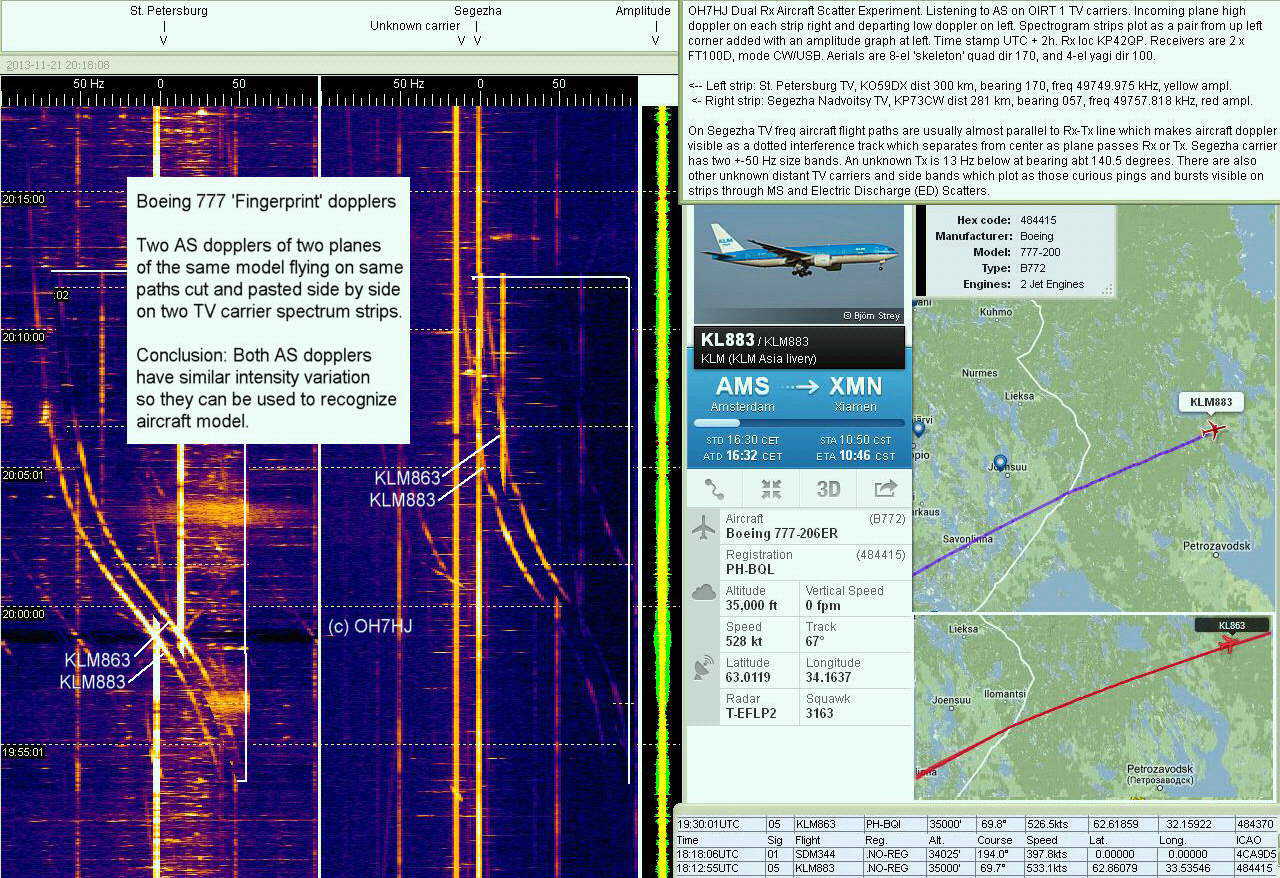
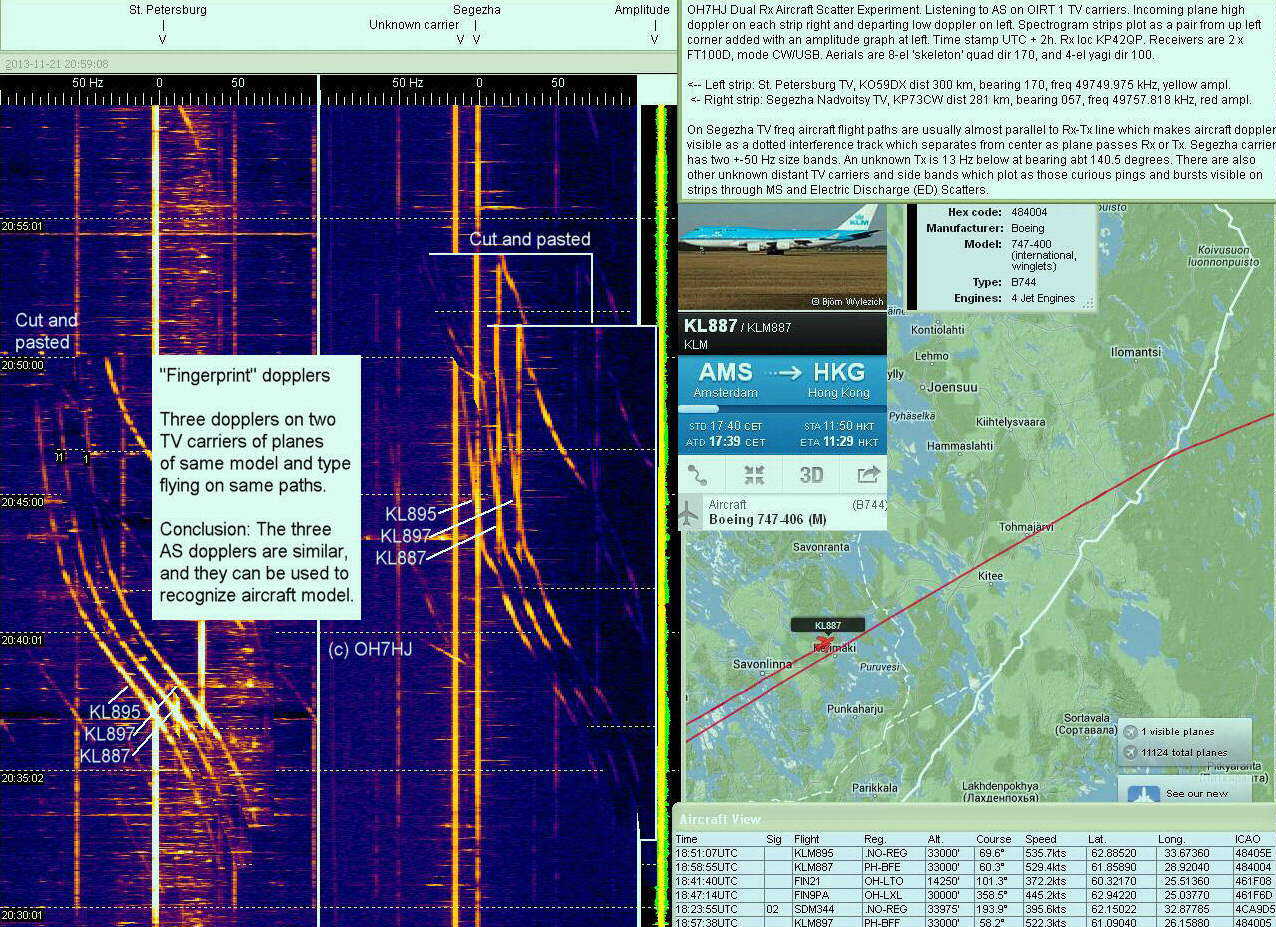
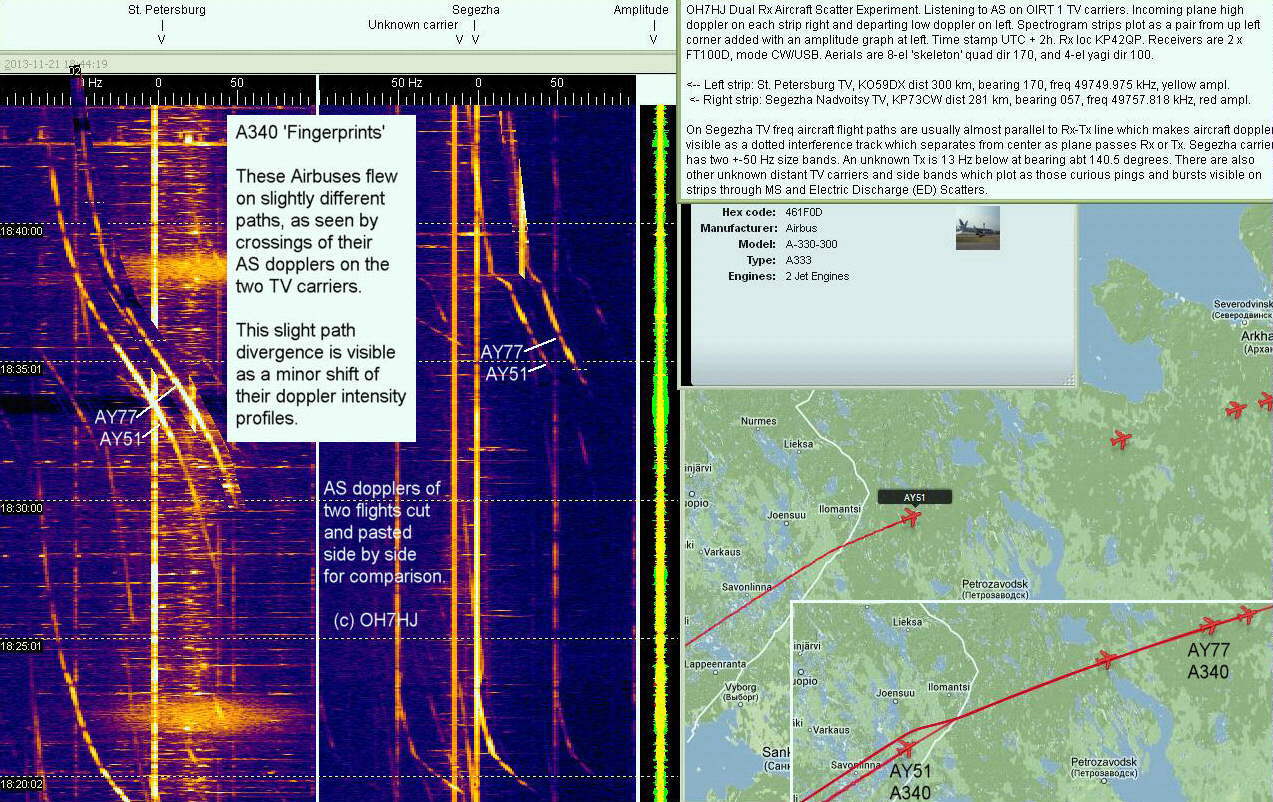
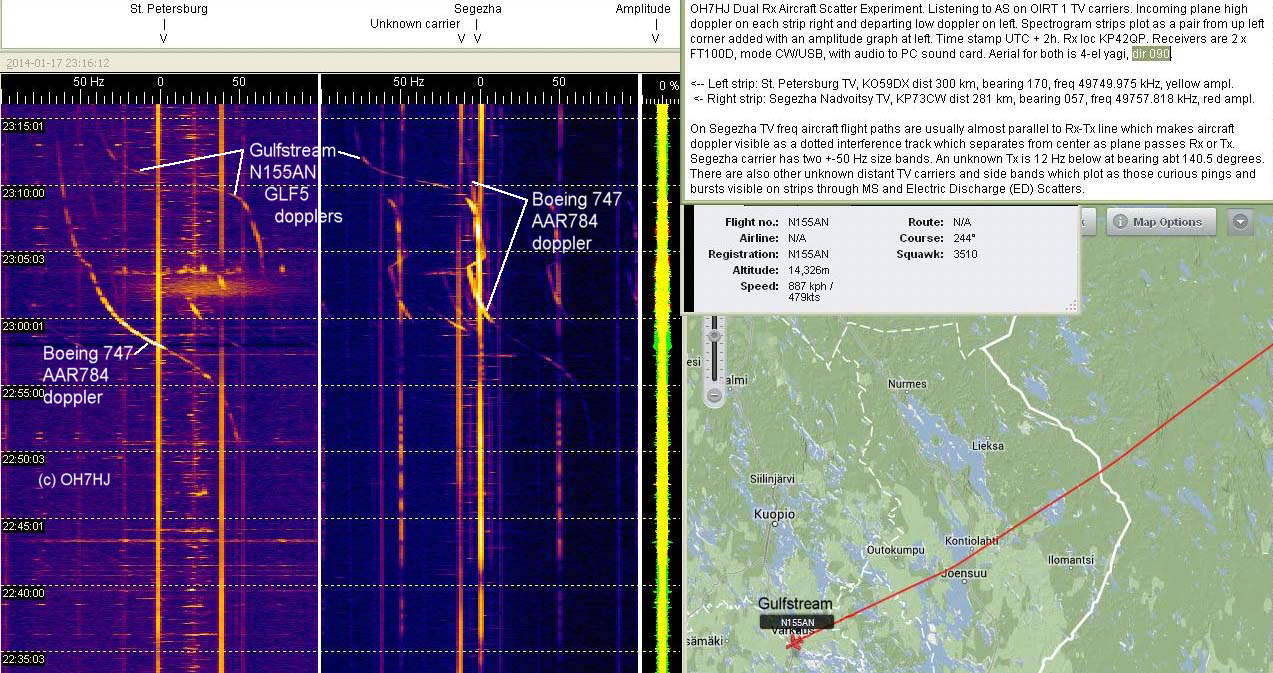
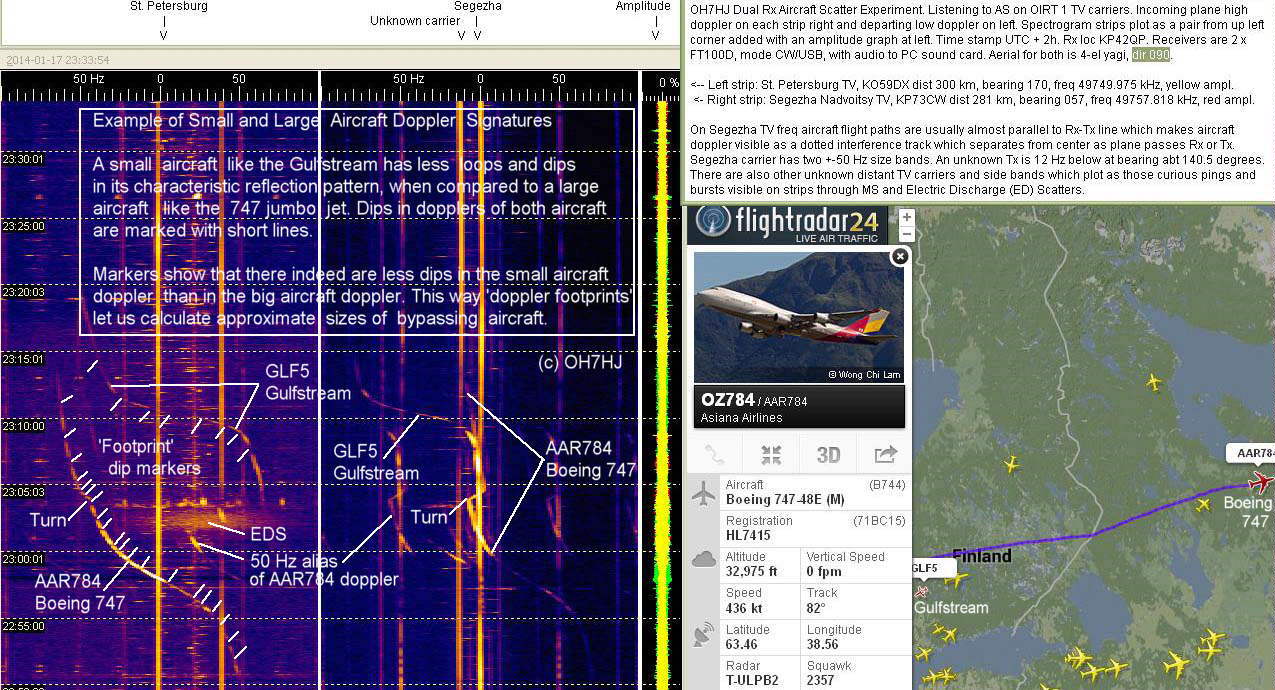
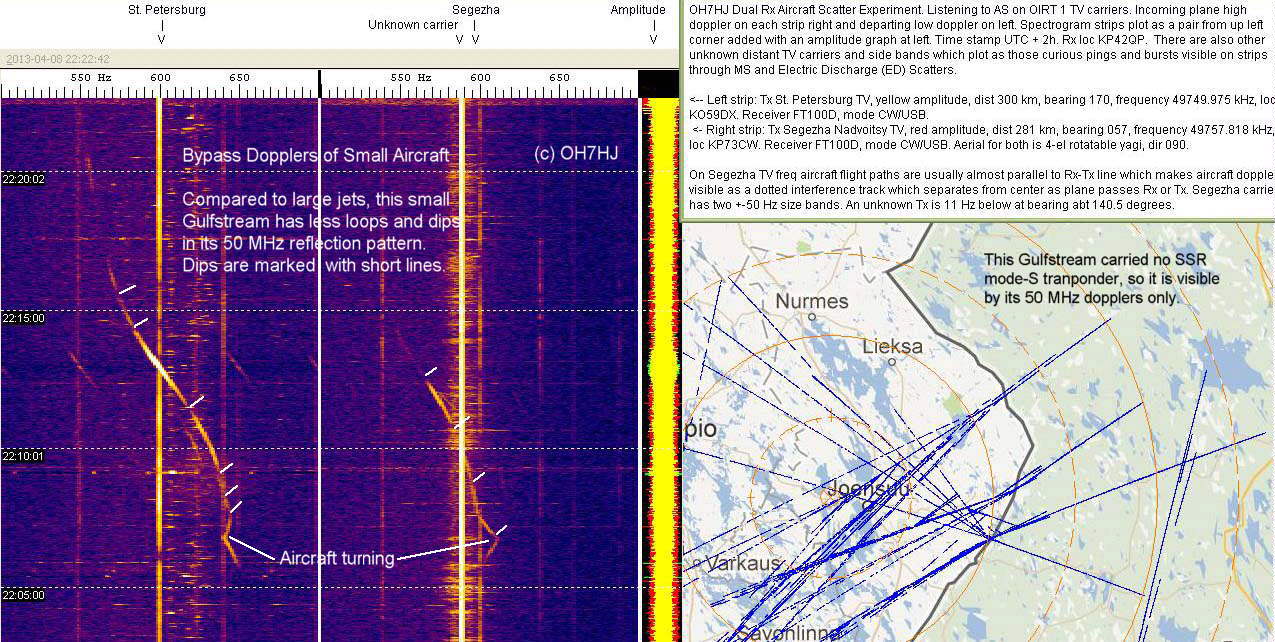
Each aircraft draws an aircraft scatter (AS) doppler curve as it scatters radio waves, which in this experiment originate from two 6 m band TV transmitters (Tx). The velocity of each aircraft can be read from its doppler shift, but can the curious thick and narrow segments plotted to its AS doppler curve be used for anything useful? By this experiment, it looks like they could be used for recognizing or confirming model of aircraft.
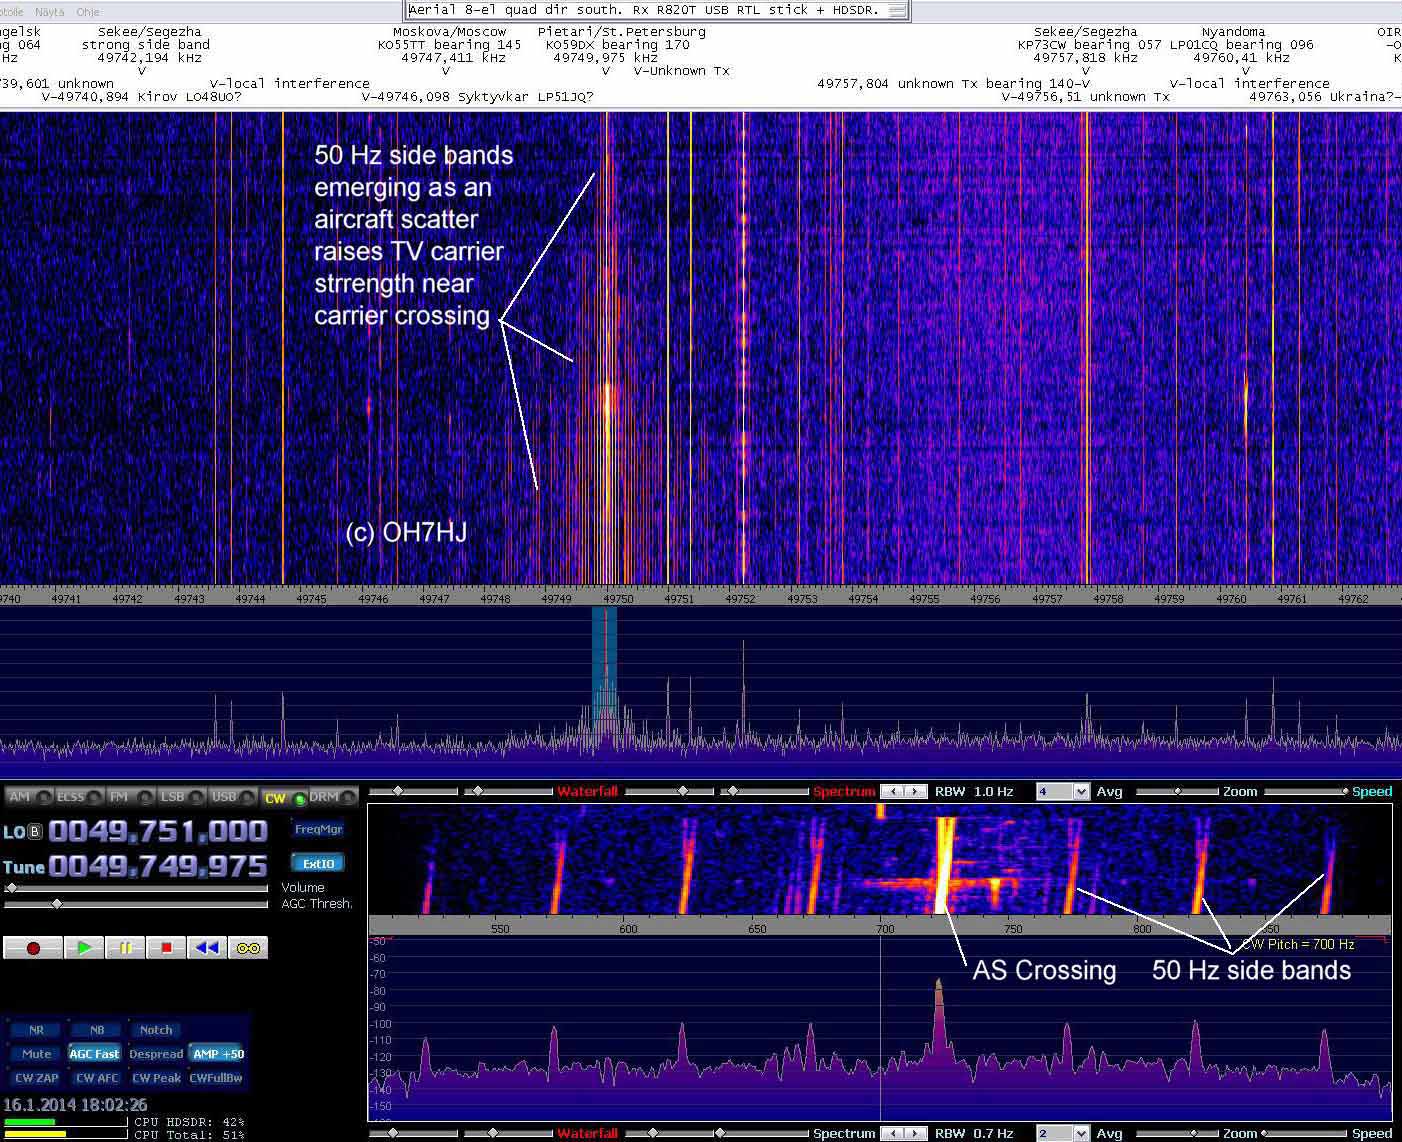
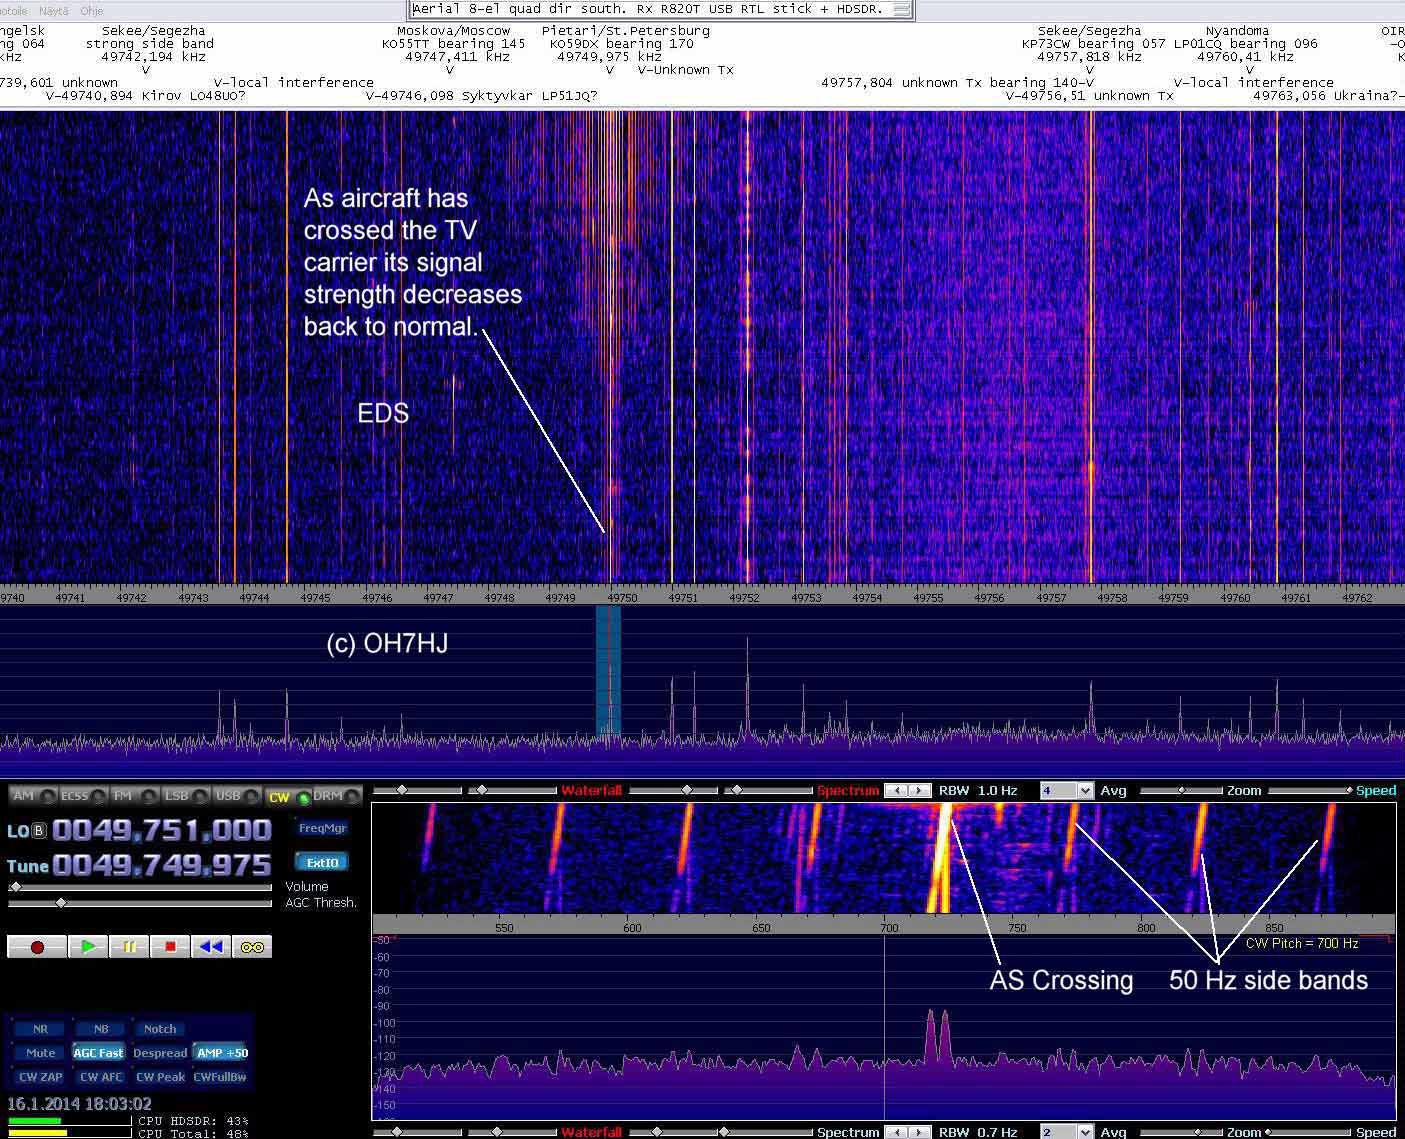
For anyone familiar with aerials, the AS doppler track intensity modulation is easy to understand: The aircraft behaves like an aerial, reflecting radio waves with a characteristic directional pattern defined by its size and geometry, related to wavelength, and to the angle of reflection.
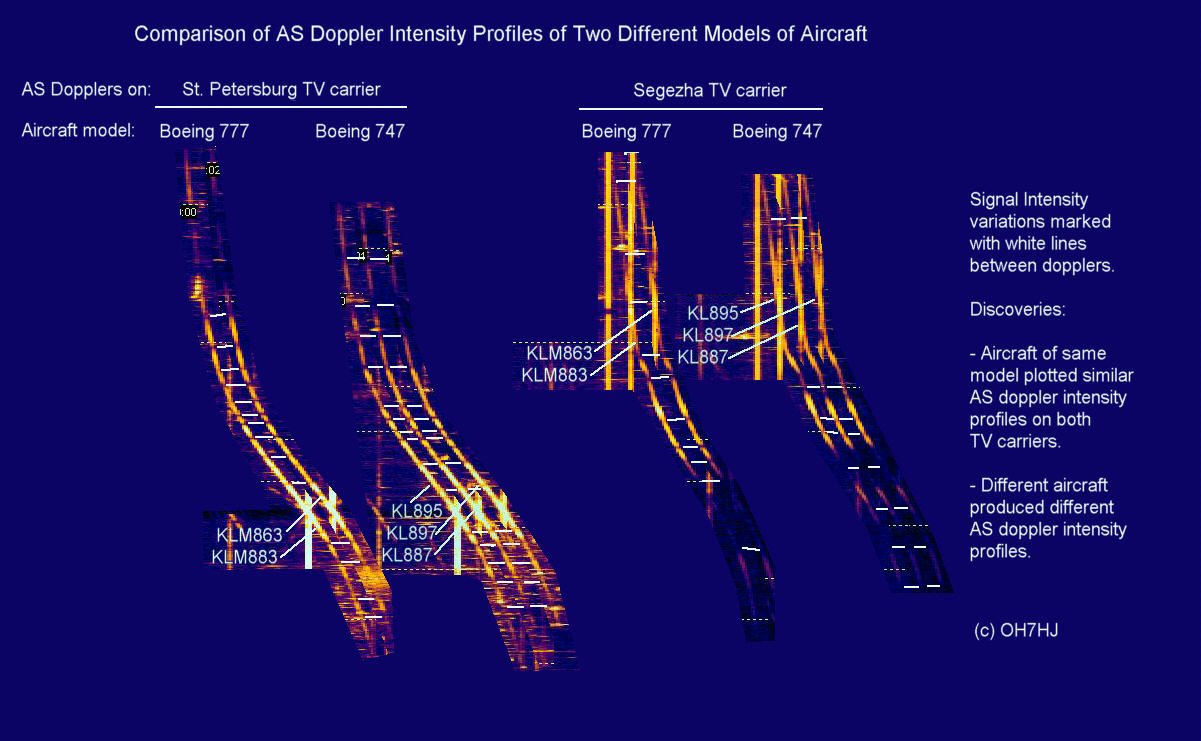
When the lobes of this AS directional pattern are directed towards the receiver (Rx), the doppler is plotted as a thick strong line. As the minimums between lobes of the scattering aircraft directional patterns are aligned towards Rx, the received signal fades, and the doppler track plots thinner or even vanishes for a while.
Aircraft Scatter ‘Fingerprints’
Again thinking of an aircraft behaving as a reflecting aerial, redirecting the wavefront radiatied from the Tx, the directional pattern of this ‘aircraft aerial’ is characteristic of the particular aircraft, because it is defined by aircraft size and shape. Further, we may conclude that if similar aircrafts are flying along the same path in relation to Tx and Rx, also the intensity variation of their AS dopplers should be similar. Now, could this characteristic doppler intensity variation be used as an aircraft model recognizing intensity profile or radar signature, a kind of ‘doppler fingerprint’ or ‘radar DNA’…?
To check, if this aircraft model characteristic intensity variation can be measured in reality, I plotted a few usual dopplers of planes flying almost along same paths on their Far East routes. Then I copied and pasted their Spectrum Lab dopplers side by side for easy comparison.
The results of this experiment were positive: Planes of same models plotted similar AS intensity profiles, and planes of different models plotted different kind AS intensity profiles. These first experiments of classifying aircraft models by radiotechnical measurement based on their AS dopplers are illustrated with accompanying images, showing similar doppler ‘fingerprint’ profiles of similar aircraft.
- OH7HJ -

 Ominaisuuksia on kuvattu maanpuolustusnetin ketjussa ‘Monipaikkatutkajärjestelmä’:
